Variables in a Thesis: Roles, Definitions, and Templates

Variables in a thesis are the named characteristics or conditions you measure, manipulate, or hold constant to test your research question. Before you write a single line of your Methods section, three actions come first: assign each variable a clear role, write a precise operational definition with an instrument and coding scheme, and plan exactly how you will report measurement decisions and handle missing data or outliers.
Here is the short checklist to run right now:
- Assign roles. Label every variable as independent, dependent, control, moderator, or mediator based on your study’s causal logic.
- Operationalize. Write a one-sentence operational definition for each variable, naming the instrument, units, and coding.
- Plan reporting. Decide in advance how you will describe distributions, transformations, and missing-data handling in your Results.
The Office of Research Integrity (ORI) defines variables as the names given to variance researchers wish to explain, a framing that keeps the focus where it belongs: on what you are actually measuring and why. Scribbr’s methodology resources confirm that research variables fall into five standard roles. Rivary’s downloadable Word templates include pre-formatted operationalization tables so you can fill in those roles without building the structure from scratch.
Table of Contents
- What are the main types of variables in thesis research?
- How do measurement scales shape your analysis choices?
- How do you identify variables from your research question?
- How do you turn a concept into a measurable thesis variable?
- What mistakes do students make with thesis variables?
- How do you report variables in your Methods and Results?
- Thesis-ready templates and a quick verification checklist
- Key Takeaways
- The part of variable work most students skip
- How Rivary helps you build your variable framework faster
- Useful sources for thesis variable work
What are the main types of variables in thesis research?
Every variable in your thesis plays a specific role in your argument, and getting those roles right is what separates a defensible Methods section from a vague one. The ORI frames the distinction clearly: in experimental work, the independent variable is what researchers manipulate, while the dependent variable is what they observe as an outcome.
Here are the five roles you need to know, with one concrete example for each:
Independent variable (IV): The presumed cause or treatment. In a study on study hours and GPA, study hours per week is the IV.

Dependent variable (DV): The outcome you measure. In that same study, GPA is the DV.
Control variable: A factor you hold constant or statistically adjust for so it does not confound your results. Socioeconomic status is often controlled in educational research.
Moderator: A variable that changes the strength or direction of the IV-DV relationship. Gender might moderate the relationship between stress and academic performance, meaning the effect looks different for men and women.
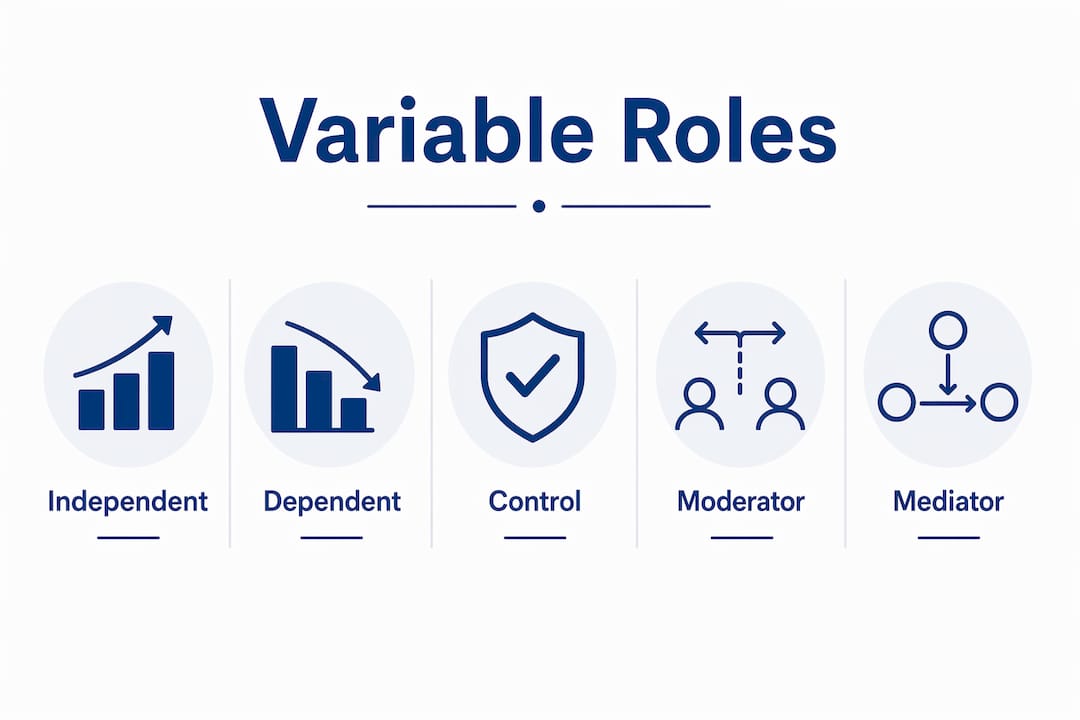
Mediator: A variable that explains the mechanism linking IV to DV. Self-efficacy could mediate the relationship between study hours and GPA, explaining why more study time produces better grades.
One practical rule worth memorizing: if you can plausibly flip the arrow and argue the DV causes the IV, your causal logic needs rethinking. In descriptive or observational studies, the ORI notes that variables are observed rather than manipulated, so researchers should report associations rather than causal claims and be careful about which label they apply.
How do measurement scales shape your analysis choices?
Knowing your variable’s measurement scale is not a formality. It determines which statistics are valid, which tests you can run, and what you can honestly claim in your Results. Measurement scales map directly to analytic choices, and selecting the wrong test for a given scale produces invalid conclusions.
| Scale | Typical measures | Example | Suggested analysis |
|---|---|---|---|
| Nominal | Frequencies, mode | Ethnicity, treatment group | Chi-square, logistic regression |
| Ordinal | Median, IQR | Likert satisfaction rating | Mann-Whitney U, Spearman correlation |
| Interval | Mean, SD, t-test | Temperature (°C), IQ score | t-test, ANOVA, Pearson correlation |
| Ratio | All above + geometric mean | Reaction time (ms), income ($) | Regression, ANOVA, ratio comparisons |
Beyond scale, you also need to distinguish discrete from continuous variables. Discrete variables take whole-number counts (number of therapy sessions attended). Continuous variables can take any value within a range (body mass index, response latency). In practice, count variables with a wide enough range are often treated as continuous in regression models, though Poisson or negative binomial regression may be more appropriate when counts are low or skewed.
A few quick rules for test selection: chi-square works for nominal-by-nominal relationships; t-tests and ANOVA require at least interval-level data; Pearson correlation assumes interval or ratio scales; nonparametric alternatives like Spearman or Kruskal-Wallis step in when distributions are badly skewed or sample sizes are small. Locking in scale type early, before you collect data, prevents the painful situation of discovering your planned analysis does not fit your actual data.
How do you identify variables from your research question?
Most students already have a research question before they think carefully about variables. The trick is converting that question into a structure that makes roles obvious.
Step 1: Rewrite your question as an if-then sentence. “If [X] increases, then [Y] will change.” This forces you to name a cause and an effect.
Step 2: Label the presumed cause as independent and the outcome as dependent. The cause comes first in time and is either manipulated (experiment) or treated as the predictor (observational study).
Step 3: Apply the Graphic Tutorial test from USC Libraries. Insert your variable names into this sentence: “The [independent variable] causes a change in [dependent variable], and it is not possible that [dependent variable] could cause a change in [independent variable].” If the sentence holds up logically, your role assignment is sound.
Worked example:
Research question: Does social media use affect adolescent sleep duration?
- If-then: If social media use increases, then sleep duration decreases.
- IV: Daily social media use (hours)
- DV: Sleep duration (hours per night)
- Graphic Tutorial test: “Daily social media use causes a change in sleep duration, and it is not possible that sleep duration could cause a change in daily social media use.” This mostly holds, though a bidirectional relationship is plausible, which is worth noting as a limitation.
Practice exercise: Take your own research question and write the if-then version. Name the IV and DV. Run the Graphic Tutorial test. If the reverse-causality sentence sounds equally plausible, you may need a longitudinal design or a clearer theoretical argument for directionality.
Checklist for verifying role assignment:
- Does the IV precede the DV in time?
- Is the IV manipulated (experiment) or treated as a predictor (observational)?
- Is reverse causality implausible, or at least theoretically weaker than the forward direction?
- Is each variable assigned exactly one role in this analysis?
How do you turn a concept into a measurable thesis variable?
Operationalization is where abstract ideas become something you can actually measure. “Stress” is a concept. “Score on the Perceived Stress Scale (PSS-10), ranging from 0 to 40, with higher scores indicating greater perceived stress” is an operational definition. The difference matters enormously for replication: precise measurement instructions define the instrument, units, coding scheme, and any reliability or validity evidence so another researcher can reproduce your results.

Your Methods section needs both the conceptual definition (what the construct means theoretically) and the operational definition (exactly how you measured it). Here is a template table you can copy directly into your thesis:
| Variable name | Conceptual definition | Operational definition | Instrument | Units / coding | Reliability / validity |
|---|---|---|---|---|---|
| Perceived stress | Subjective appraisal of situational demands exceeding coping resources | Total score on PSS-10 | Perceived Stress Scale (Cohen, 1983) | 0–40; higher = more stress | Cronbach’s α reported in prior studies |
| Academic performance | Degree to which a student meets course learning objectives | Cumulative GPA at end of semester | University transcript | 4-point scale | Official institutional record |
| Gender | Self-identified gender category | Response to single-item question: “What is your gender?” | Self-report survey | 0 = man, 1 = woman, 2 = non-binary/other | N/A |
| Weekly exercise | Frequency and duration of physical activity | Self-reported hours of moderate-to-vigorous exercise per week | 7-day recall item | Hours (continuous) | Test-retest reliability reported in validation study |
Sample Methods phrasing you can adapt:
“Perceived stress was measured using the Perceived Stress Scale (PSS-10; Cohen, 1983), a 10-item self-report instrument scored from 0 to 40. Academic performance was operationalized as cumulative GPA obtained from university records. Gender was assessed via a single self-report item with three response options (man, woman, non-binary/other), coded 0, 1, and 2, respectively.”
For coding advice: use numeric codes for categorical variables (dummy coding for binary categories, effect coding for multi-level ones). Document every coding decision in a codebook, even if it seems obvious. Reviewers and examiners will check.
Pro Tip: Run a brief pilot test with 5–10 participants before full data collection. If participants misread a question or if your coding scheme produces unexpected values, you catch it early. Note the pilot in your Methods as evidence of instrument refinement.
What mistakes do students make with thesis variables?
Even well-designed studies stumble on a short list of recurring errors. Knowing them in advance is cheaper than discovering them during your defense.
-
Vague operational definitions. Saying you measured “well-being” without specifying the instrument and scoring method is a replication-killer. Missing operational definitions prevent examiners from assessing validity. Every latent construct needs a named proxy measure with a rationale.
-
Using the same variable as both IV and DV. This is logically circular and statistically meaningless. Role assignment must be fixed before analysis begins.
-
Omitted confounders. If a third variable causes both your IV and DV, your estimated relationship is biased. Literature review should surface the most plausible confounders; include them as control variables and justify each one.
-
Multicollinearity among predictors. When two predictors correlate strongly (r > .80 is a common rule of thumb), their individual effects become unstable. Check variance inflation factors (VIFs) and consider dropping or combining redundant predictors.
-
Overcontrol. Controlling for a mediator removes the very mechanism you are trying to study. If self-efficacy mediates the effect of study hours on GPA, adding self-efficacy as a control variable in a simple regression will suppress the IV’s effect and mislead your interpretation.
-
Reverse causality. Cross-sectional data cannot establish direction. If your design is observational, acknowledge the possibility of reverse causality as a limitation and, where possible, use prior-wave data or theoretical arguments to defend your causal ordering.
For moderation analyses, pre-specify whether you will center continuous predictors before computing interaction terms. Centering reduces multicollinearity between main effects and the interaction term and makes coefficients more interpretable. Report VIFs in an appendix. For mediation, use a design where the mediator is measured after the IV but before the DV, or use a longitudinal or experimental design that supports the temporal ordering.
When your model includes multiple predictors, keep it parsimonious. Adding variables to improve fit without theoretical justification inflates Type I error and makes your model harder to defend. An analysis plan or pre-registration, even an informal one filed before data collection, signals rigor to examiners.
How do you report variables in your Methods and Results?
Clear reporting is what lets an examiner trust your analysis without having to guess what you measured or how. The standard approach: introduce variables and their rationale in your Introduction or Literature Review, then detail operationalization, coding, and model entry in your Methods. Control variables belong in both places: justify them in the literature review, then specify their measurement in Methods.
Sample Methods paragraph:
“The independent variable, daily social media use, was operationalized as self-reported hours of social media use per day averaged over the past seven days (M = 3.2, SD = 1.8). The dependent variable, sleep duration, was measured as self-reported average hours of sleep per night over the same period (M = 6.9, SD = 1.1). Age and gender were included as control variables based on prior evidence of their association with both social media use and sleep outcomes (Smith & Jones, 2022). Missing data on sleep duration (n = 4, 2.1%) were handled via listwise deletion given the low rate of missingness. One outlier on social media use (> 3 SD above the mean) was winsorized to the 99th percentile value.”
A variable table for your Methods section might look like this:
| Variable | Role | Operational definition | Coding | N | Missing |
|---|---|---|---|---|---|
| Social media use | IV | Avg. hours/day, 7-day self-report | Continuous | — | 0 |
| Sleep duration | DV | Avg. hours/night, 7-day self-report | Continuous | — | 4 (2.1%) |
| Age | Control | Years at time of survey | Continuous | — | 0 |
| Gender | Control | Self-report, single item | 0 = man, 1 = woman, 2 = other | — | 0 |
For Results, use phrases like: “Prior to analysis, the distribution of [variable] was examined for normality using the Shapiro-Wilk test (W = .97, p = .14). A log transformation was applied to [variable] to reduce positive skew. Missing values on [variable] (n = 4) were handled via listwise deletion.”
Reliability metrics (Cronbach’s alpha for multi-item scales, inter-rater reliability for coded data) belong in the Methods, right after the instrument description. If you used a validated scale, cite the original validation study and report the reliability coefficient from your own sample.
Thesis-ready templates and a quick verification checklist
Copy-paste operationalization templates for the most common variable types:
Demographics: “[Variable] was assessed via a single self-report item. [Age] was recorded in years (continuous). [Education level] was coded on a five-point ordinal scale (1 = less than high school, 5 = graduate degree).”
Survey construct: “[Construct] was measured using the [Scale Name] ([Author, Year]), a [N]-item instrument rated on a [X]-point Likert scale (1 = [anchor], [X] = [anchor]). Total scores range from [min] to [max], with higher scores indicating greater [construct]. Internal consistency in the current sample was α = [value].”
Behavioral count: “[Behavior] was operationalized as the number of [events] occurring within [time window], recorded via [method: observation log / app data / self-report]. Values ranged from [min] to [max] (M = [value], SD = [value]).”
Physiological measure: “[Measure] was assessed using [device/instrument] following [protocol]. [Units] were recorded at [time point(s)]. Calibration was performed according to manufacturer guidelines prior to each session.”
Verification checklist — run this for every variable before submitting your Methods draft:
- Role assigned (IV, DV, control, moderator, or mediator)?
- Measurement scale recorded (nominal, ordinal, interval, or ratio)?
- Instrument named and cited?
- Coding scheme specified (numeric codes, units, direction of scoring)?
- Missing-data plan stated?
- Reliability or validity evidence noted (where applicable)?
One example row filled out for a typical social-science variable:
| Variable name | Conceptual definition | Operational definition | Instrument | Units / coding | Reliability |
|---|---|---|---|---|---|
| Loneliness | Subjective sense of social isolation | UCLA Loneliness Scale (3-item version) total score | Russell [citation] | 3–9; higher = more lonely | α reported for current sample |
Rivary’s structured Word templates include a pre-formatted version of this table with placeholder rows, so you can drop in your own variables without formatting from scratch. Store your completed variable table in a clearly labeled file (e.g., thesis_variable_codebook_v1.docx) and update it every time a coding decision changes. Version control on your codebook prevents the confusion of having two slightly different coding schemes in circulation.
Pro Tip: Label your codebook file with a version number and date every time you revise it. If your supervisor or committee asks why a variable was coded a certain way, you want a dated record, not a memory.
Key Takeaways
Assigning precise roles and operational definitions to every variable before analysis is the single most protective step a Master’s student can take against examiner criticism.
| Point | Details |
|---|---|
| Assign roles before analysis | Label every variable as IV, DV, control, moderator, or mediator based on causal logic and time ordering. |
| Operationalize precisely | Write a one-sentence operational definition naming the instrument, units, coding, and reliability evidence. |
| Match scale to analysis | Use the nominal/ordinal/interval/ratio classification to select valid statistical tests and avoid invalid claims. |
| Document everything | Include a variable table in Methods and a full codebook in an appendix; justify control variables in the literature review. |
| Rivary templates | Rivary’s downloadable Word templates include pre-formatted operationalization tables and Methods paragraph structures ready to fill in. |
The part of variable work most students skip
Students spend hours on statistical tests and almost no time on the step that makes those tests defensible: writing clean operational definitions before data collection. The operational definition is not bureaucratic paperwork. It is the argument that your measurement actually captures the construct you claim it does. An examiner who disagrees with your operationalization can question your entire findings chapter, regardless of how sophisticated your analysis is.
The other thing students underestimate is the cost of discovering a measurement problem after data collection. A vague item, an ambiguous coding rule, a missing reliability check — these are fixable before you collect data and nearly unfixable after. The verification checklist in this article takes about ten minutes per variable. That is a reasonable investment against weeks of revision.
One tactical suggestion: write your variable table before you write your Methods section, not after. The table forces you to name every decision explicitly. Gaps in the table are gaps in your design, and it is far better to find them at the planning stage. Once the table is complete, the Methods paragraph almost writes itself.
How Rivary helps you build your variable framework faster
Defining and operationalizing variables is one of the most time-consuming parts of thesis writing, and it is also one of the easiest to get wrong without a clear template in front of you. Rivary gives Master’s students a concrete head start: the platform offers free personalized thesis topic suggestions and AI-generated research questions, so you arrive at the variable-definition stage with a focused, testable question already in hand.
For the Methods section itself, Rivary’s paid downloads include structured Word templates formatted in APA-7, with pre-built operationalization tables, variable codebook samples, and Methods paragraph templates you can adapt to your own study. Complete sample thesis papers show exactly how variables are introduced, operationalized, and reported across disciplines, so you have a real model to follow rather than guessing at the conventions. Every resource is available for immediate download after checkout. Start with the free topic suggestion to sharpen your research question, then grab the template that fits your thesis stage at ki.rivary.de.
Useful sources for thesis variable work
-
ORI Module 3: Elements of Research — The Office of Research Integrity’s foundational module on research variables, covering the distinction between independent and dependent variables in experimental and observational designs. Use this when you need an authoritative definition to cite in your Methods.
-
Scribbr: Types of Variables in Research & Statistics — A thorough overview of variable roles, measurement scales, and operationalization with examples across disciplines. Useful for checking your role assignments and linking scale type to analytic choices.
-
USC Libraries: Identifying Variables (Graphic Tutorial) — The source of the Graphic Tutorial sentence test for verifying IV-DV role assignments. Run this exercise on every variable pair in your study.
-
SimplyPsychology: Independent vs. Dependent Variables — Clear definitions and examples with practical guidance on operationalization and measurement. Good supplementary reading when writing your Methods paragraph.
-
Academia Stack Exchange: Control variables in thesis — Community consensus on where to introduce and justify control variables (Introduction/Literature Review for rationale, Methods for operationalization). Useful when your supervisor asks why a control variable appears where it does.